Introduction
In the world of data analysis and decision-making, understanding pattern, time-series data is a separate field of study. Time-series data, which records observations over time, can be applied in various domains, such as finance, economics, climate science etc. To help unravel these patterns and identify underlying trends, the first option taken up is Simple Moving Average
What is Simple Moving Average (SMA)
A Simple Moving Average (SMA) is used for statistical calculation in time series analysis and forecasting. It involves calculating the average value of a set of data points over a specific period of time. In the context of forecasting, the simple moving average is used to identify the trend in historical data and then predit trends into the future
Formula :
- MA(T)=[X(T)+X(T-1)+X(T-2)…..]/N
- MA(T) moving average @ time T
- X(T) actual data point (sum(subtotal))
- N Number of data point (Window length)
Example
DAY | SALES | 3-DAY MOVING AVERAGE |
|---|---|---|
| 1 | 50 | N/A |
| 2 | 45 | N/A |
| 3 | 60 | N/A |
| 4 | 55 | 51.66 |
| 5 | 65 | 53.33 |
| 6 | 70 | 60 |
| 7 | 75 | 63.33 |
| 8 | 80 | 70 |
| 9 | N/A | 75(Predicted data) |
| 10 | N/A | 51.66 (Predicted data) *Deteriorated data |
Key Considerations
- Forecasting limited to a single period, regardless of window duration.
- Precision tied to the number of periods.
- Straightforward approach, similar to a brute force method
- Deterioration in data quality becomes evident when making predictions beyond the initial forecasted period.
- It is attributed to variable values is null or blank
Dataset Information
The sample dataset from Industry schema is as follows. Focus on the “salesorderheader” relation along with a data stats profile.
Field | Type | Candidate Variable |
|---|---|---|
| OrderID | Character | |
| CustomerID | Integer | |
| ShipDate | Timestamp | ✔ |
| SalespersonemployeeID | Integer | |
| ShipMethodID | Integer | |
| TerritoryID | Integer | |
| SubTotal | Numeric | ✔ |
Number of records : 1561
Candidate keys | Number of unique values | Max Value | Min Value |
|---|---|---|---|
| Subtotal | 623 | 129,261.254 | 2.29 |
| ShipDate | 675 | 2014-05-01 | 2011-06-01 |
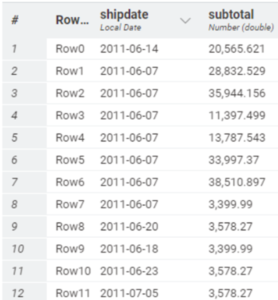
Snapshot of the data
Workflow Details
Within the KNIME platform, access the dataset and select the relevant columns for analysis. “SubTotal” column is the candidate variable for applying the Simple Moving Average technique. The output of this method, smoothes out fluctuations and identifies trends in the data. After calculating the moving averages, visual representation is created that effectively showcases the forecasted values.
Reading & Manipulating Data
- Data is read via DB connector node and fed into KNIME via DB reader. Data can be selected directly from tables or via SQL query. After choosing appropriate relations, extract the necessary primary candidate key.
- SubTotal values are grouped by applying an aggregate function sum, and this grouping is based on the months of the year.
Forecasting
- Execute the Simple Moving Average methodology on the data present in the “SubTotal” column using standard node.
- Configure the moving average node by selecting the necessary column and setting the window size. Here the window size is 3.
- Moving Average window size has a direct relation with data volatility.
- Depending on the use case, window size can be low or highly volatile data like stock markets.
- The window size of day-level data is smaller than that of month-level data because day-level data captures finer-grained details and fluctuations, while month-level data provides a broader overview and smoother trends.
Visualization
Summary
- SMA is straightforward to calculate, can help smooth out short-term fluctuations in data, making it easier to identify underlying trends.
- The resulting moving average line is easy to understand, making it suitable for quick visual analysis.
- Accurate predictions are achieved when the data points remain consistent.
- SMA’s accuracy relies heavily on the number of periods in the moving average window, which could lead to suboptimal results when applied to data with irregular patterns.
- To address these challenges, the Weighted Moving Average (WMA) technique can be used.
- WMA’s ability to emphasize recent data makes it more adaptable to volatile or rapidly changing environments


