Introduction
In time series forecasting, there are two popular methods for triple exponential smoothing: TEMA (Triple Exponential Moving Average) and Holt-Winters method. Both methods are used to smooth out general trends along with seasonality factor in the data and improve prediction accuracy. However, there are some key differences between the two methods. TEMA uses three stage weighted averages of average to smooth the data whereas Holt-Winters uses a method that takes into account both trend and seasonality.
Holt-winters Triple Exponential Smoothing
Holt Winters method extends the concept of double exponential smoothing to account for both a Trend, Level and seasonality of the data. It employs three smoothing factors, one for the level (α – alpha) , one for the trend (β – beta) and one for seasonality (Ɣ -gamma)
Holt-Winters Triple exponential smoothing Formula:
- Level (Lt)
Lt = α * (Yt – St-m) + (1 – α) * (Lt-1 + Tt-1)
- Trend (Tt):
Tt = β * (Lt – Lt-1) + (1 – β) * Tt-1
- Seasonality (St):
St = Ɣ * (Yt – Lt) + (1 – Ɣ) * St-m
- Forecasting:
Forecast for time t + h (Ft+h) = (Lt + Tt )* St-m
- Notes
h : number of time steps into the future to forecast.
α , β , Ɣ : smoothing parameters
Yt : actual data point at time t
St-m : seasonal index at time t-m
Tt-1 : trend at time t-1
Example Holt-winters Double Exponential Smoothing
Date | Sales | Level | Trend | Season | Forecast |
|---|---|---|---|---|---|
| Jan | 196992.14 | 1.31 | |||
| Feb | 185055.30 | 1.23 | |||
| Mar | 193550.11 | 1.29 | |||
| Apr | 26434.74 | 0.18 | |||
| May | 172660.55 | 131917.99 | 105483.25 | 1.31 | |
| June | 102883.79 | 237401.24 | 105483.25 | 1.23 | 421589.29 |
| Jul | 49318.84 | 342884.49 | 105483.25 | 1.29 | 576591.17 |
| Aug | 92559.94 | 448367.74 | 105483.25 | 0.18 | 97276.57 |
| Sept | 112078.25 | 553850.98 | 105483.25 | 1.31 | 862968.06 |
| Oct | 117342.13 | 659334.23 | 105483.25 | 1.23 | 940371.66 |
| Nov | 145550.32 | 764817.48 | 105483.25 | 1.29 | 1119187.82 |
| Dec | 80724.65 | 870300.73 | 105483.25 | 0.18 | 171383.50 |
| Jan | 150454.75 | 975783.98 | 105483.25 | 1.31 | 1415214.07 |
Triple Exponential Moving Average
Triple Exponential Moving Average (TEMA) extends the standard Single Exponential Smoothing by applying the Exponential Moving Average (EMA) values thrice. Three levels of EMA applied on the data set provides better smoothened and accurate forecasts.
TEMA Formula
- TEMA = 3 * EMA(α, price) – 3 * EMA(β, EMA(α, price)) + EMA(Ɣ,EMA(β, EMA(α, price)))
- St=α*yt+(1−α)*St−1
TEMA Example
Month | DATA POINTS | EMA | EMA(β,DP) | EMA(Ɣ,(β,DP)) | TEMA |
|---|---|---|---|---|---|
| Jan | 9.75 | 9.75 | 9.75 | 9.75 | 9.75 |
| Feb | 10.09 | 9.92 | 9.852 | 9.8214 | 10.0254 |
| Mar | 10.27 | 10.18 | 10.076 | 10.0088 | 10.3208 |
| Apr | 8.98 | 9.625 | 9.847 | 9.9157 | 9.2497 |
| May | 8.79 | 8.885 | 9.181 | 9.3808 | 8.4928 |
| June | 8.23 | 8.51 | 8.66 | 8.8163 | 8.3663 |
| Jul | 8.24 | 8.235 | 8.345 | 8.4395 | 8.1095 |
| Aug | 8.97 | 8.605 | 8.457 | 8.4234 | 8.8674 |
| Sept | 9.03 | 9 | 8.842 | 8.7265 | 9.2005 |
| Oct | 9.31 | 9.17 | 9.102 | 9.024 | 9.228 |
| Nov | 10.25 | 9.78 | 9.536 | 9.4058 | 10.1378 |
Dataset Information
The sample dataset from the Industry schema is as follows, with a focus on the “salesorderheader” relation.
Field | Type | Candidate Variable |
|---|---|---|
| OrderID | Character | |
| CustomerID | Integer | |
| ShipDate | Timestamp | ✔ |
| SalespersonemployeeID | Integer | |
| ShipMethodID | Integer | |
| TerritoryID | Integer | |
| SubTotal | Numeric | ✔ |
Number of records : 1561
Candidate keys | Number of unique values | Max Value | Min Value |
|---|---|---|---|
| Subtotal | 623 | 129,261.254 | 2.29 |
| ShipDate | 675 | 2014-05-01 | 2011-06-01 |
Workflow

Reading & Manipulating Data
- The data is read via DB connector node and fed into KNIME via DB reader after choosing appropriate relation and extracting the necessary primary candidate key.
- SubTotal (i.e. measure) values are grouped by applying an aggregate function (SUM), and this grouping is based on month and year.
Forecasting
- Execute the Triple exponential smoothing methodology on the data present in the “SubTotal” column using a standard node called “moving average”.
- Window size determines alpha values for the TEMA method, which is KNIME standard.
- α = 2/(k+1) , k is the window size
- Alternatively, the entire calculation for Holt-Winter method is be performed by executing a database procedure using the node “DB Query Executer”
- Based on the degree of volatility of the data, different α, β, Ɣ values provide smoother forecasts that align with past patterns.
- Numeric Scorer node is used to calculate the root mean square error (RMSE) value to find the average error between the predicted and actual values.
Visualization

Forecast Accuracy
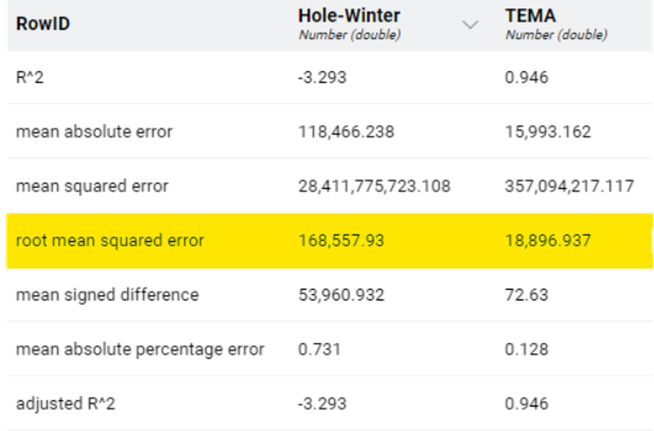
Following table compares the standard Root Mean Squared Error value for the two methods Holt-Winter and TEMA.
Summary
- Holt-Winters is particularly well-suited for data with clear trend and seasonality, as it captures these components effectively.
- TEMA, on the other hand, is valuable for data with irregular patterns or when seasonality and trend are less pronounced.
- A lower RMSE indicates better accuracy and closer alignment between the forecasted values and the actual data
- The RMSE value of Holt-winter method is very high compared to the TEMA method
- The trend doesn’t have explicit seasonality that couldn’t be captured by the Holt-Winter method
Authors
- VedhashreeU
- Kaptain