
KPI Definitions
- ACM: Aircraft Movement
- Movement: Inbound or Outbound. One inbound i.e., arrival has a corresponding outbound i.e., departure, also referred to as ‘Turnaround’.
- PAX: Passengers (revenue)
- PAX per ACM: Average number of passengers per movement. This KPI is heavily influenced by capacity and routes operated by airlines.
- Cargo: Freight in metric tonnes, includes all commercial items transported including mail.
- Destination: Airports that have a route (direct or with stops) to reach the specified destination
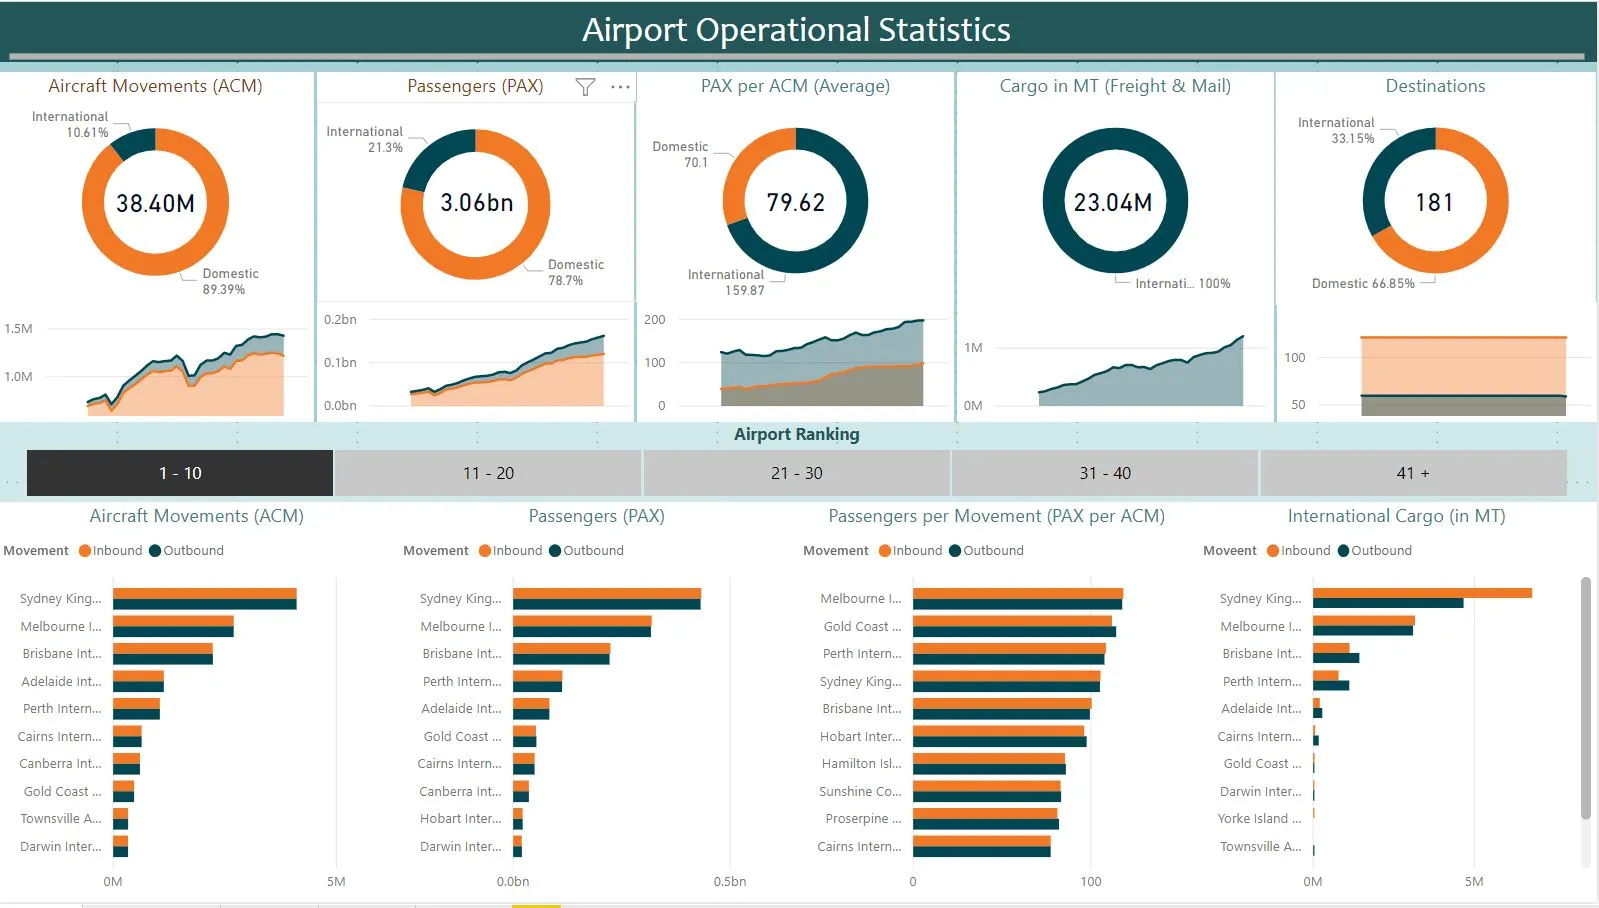
Overall Traffic Analysis

The Australian aviation market has a steady growth in all parameters like aircraft movements, passengers, and cargo. It is a positive sign, and the trend will continue on a growth pattern in the upcoming years.
(Note: Due to the nature of source data, domestic cargo is not recorded)

PAX per ACM is an interesting measure that shows the average number of passengers carried by aircraft. It is proportional to load factors calculated based on seats.
International PAX/ACM is double that of domestic values.This is because the type of aircraft operated in this sector are wide-bodied aircraft, which have very high seat capacity.
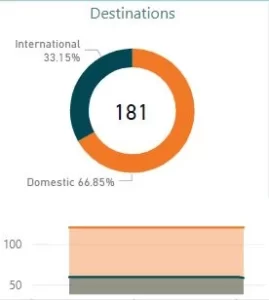
The number of destinations shows a constant trend due to non-time-dependent route data.
Data feed for traffic does not include source–destination pairs. Destinations were derived based on a different data set that provides the latest snapshot only.
Ranking and Comparison
Movement-based analysis helps in planning slots for landing/takeoff, gates, etc. in the aviation industry. The inbound and outbound traffic varies minimally due to the operations’ turnaround basis. Along with this fact, aggregated data shows almost no difference between inbound and outbound movement types.
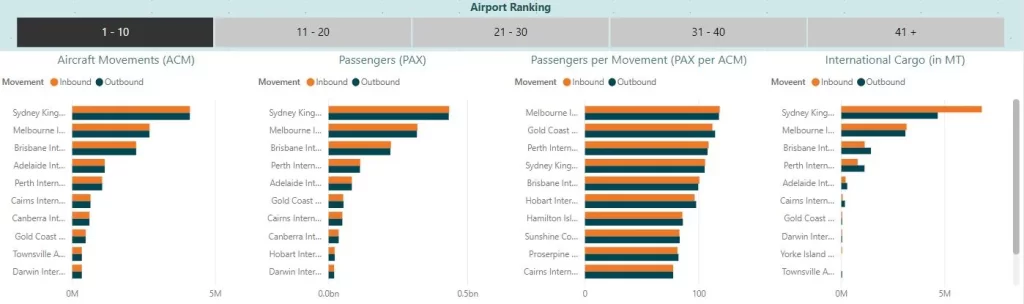
Among the total measures, the top large airports hold a consistent position across all parameters of traffic. Interesting observations in the following new metrics
- PAX per ACM: Apart from major airports, one medium-sized airport i.e., Gold Coast airports takes second place. This emphasizes that operators are able to manage efficient traffic to certain destinations. Operators are able to fill all the seats and thus ensure high load factors for all aircraft from and to the location (b) Only a few routes are available and thus passengers are forced to opt for them e.g., Sydney has 10 domestic flights whereas Gold Cost has only 4.
- Cargo: Although a major source of operational revenue, more than 80% of the market is centered around large airports. In the current data context, only international carriers are included, which could be another reason for operators to offload cargo in a hub location and later transfer it to multiple destinations.
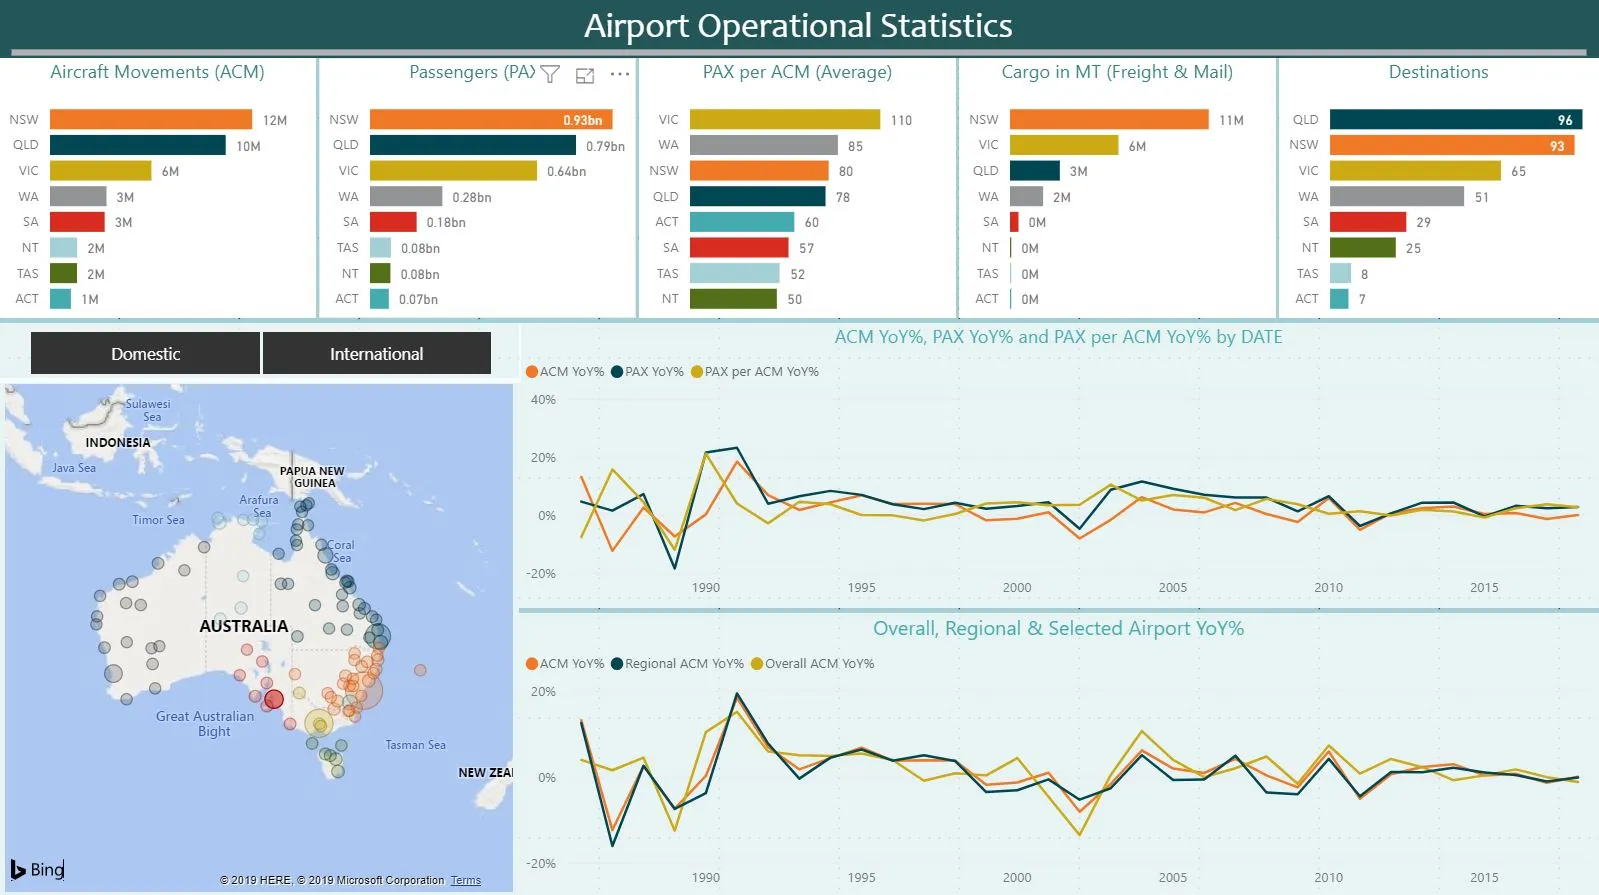
Size wise analysis

The size of an airport is an attribute that helps in comparing apples to apples. Among all measure parameters, it is evident that ‘Large’ airports have more than 60% share of combined traffic. The distribution also follows a consistent pattern in yearly trends.
In the Australian context, there are only 6 large airports against 100+ operating airports with regular aircraft movements and passenger traffic. This skews the overall pattern, where 5% of operational airports are contributing to more than 50% and in some instances 70% among various measures.
The weight of the data is critical during analysis. In this context, analyzing across the board will skew interpretation and show favorable results to heavyweights in the data set.
Large airports provide operational efficiencies by creating infrastructure to handle several aircraft during peak slot hours as well as diverse-sized aircraft with different capacities. Deciding on an airport by operators is dependent on a multitude of factors apart from the location.

A quick look at the distribution of airport categories indicates the ‘Medium’ category. The Australian aviation sector has evolved into a system of having anchor airports serving interior regions with a hub and spoke model for greater coverage.
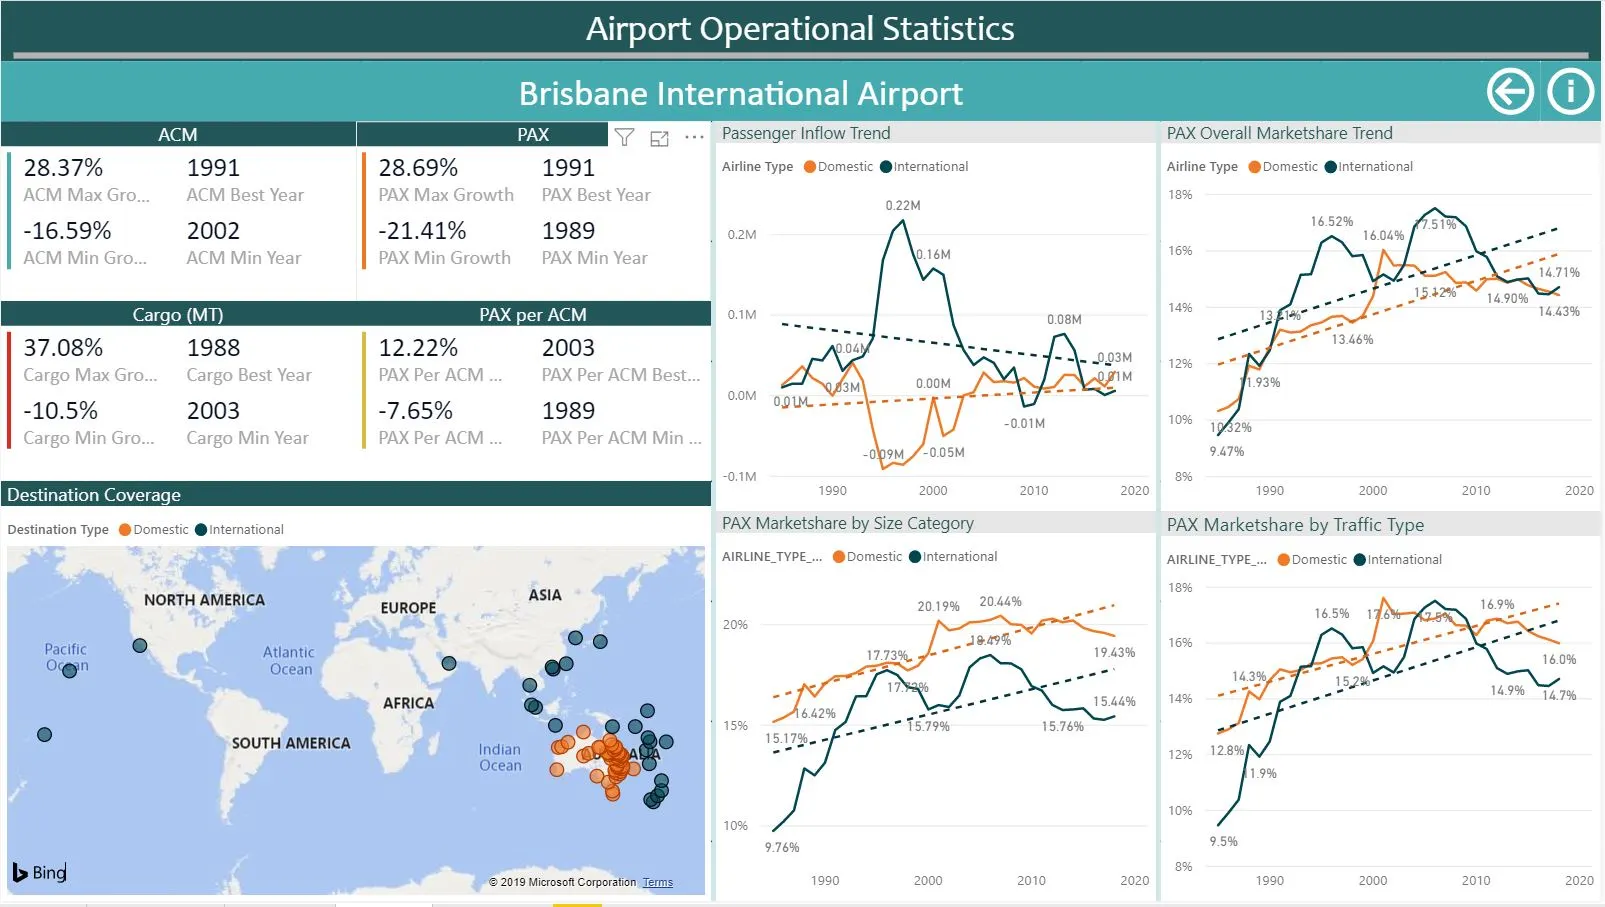
Individual Airport Snapshot KPIs

At an individual airport level, various measures are compared against the country as a whole and within each category. For the selected sample, the previous two years have been, and growth is above the national rate as well as the group’s rate.
‘Overall’ value indicates the measure across all airports countrywide and ‘Category’ indicates the size classification of the selected airport.
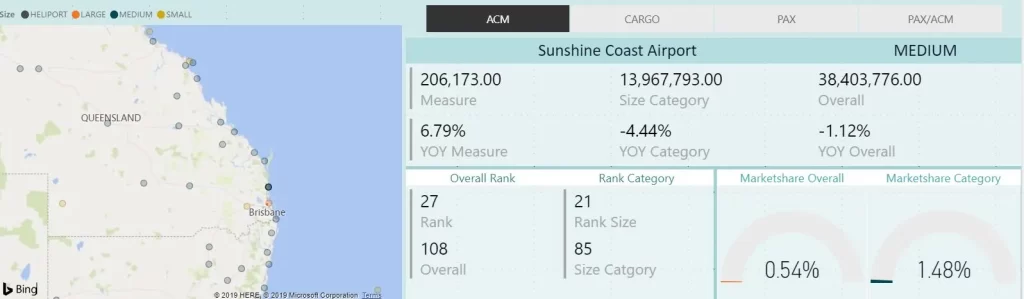
A different airport within the medium category is experiencing good growth, but overall, within the category as well as the national growth rate is falling. An interesting factor to note here is that ACM has been falling whereas PAX values are increasing, which in turn suggests that operators are implementing measures to increase load factors.
Regional Analysis
Air traffic is influenced by connectivity options. Primary airports will have multiple services connecting each other and at times the same aircraft may fly the route multiple times in a day. Interesting observations when the same measures are examined from a regional perspective.
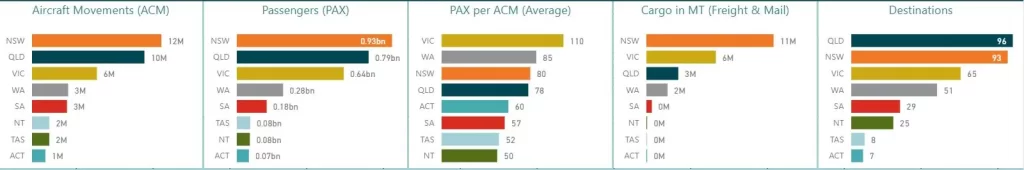
The quantum of aircraft movement and passengers puts New South Wales and Queensland on top, but the average PAX per ACM indicates a completely different picture. When PAX per ACM and Destinations are analyzed together it is evident that coverage areas for airports within the region are small and routes are efficiently managed. This factor pushes the ranking of Victoria and Western Australia higher with respect to other measures.
Trending Charting a trend pattern on a year-over-year (YOY%) basis provides insight into the relationship between variables. Two perspectives to compare for which, Aircraft Movement (ACM) is assumed as the leading indicator for other measures.
1. ACM Across Location Characteristics
- Individual Airport
- Region i.e., Location, which in the current scenario is the State.
Overall, in current scenario refers to all airports.
2. ACM (vs) PAX (vs) PAX per ACM for the selected airport
- Aircraft Movements (ACM)
- Passengers (PAX)
- Average PAX per ACM
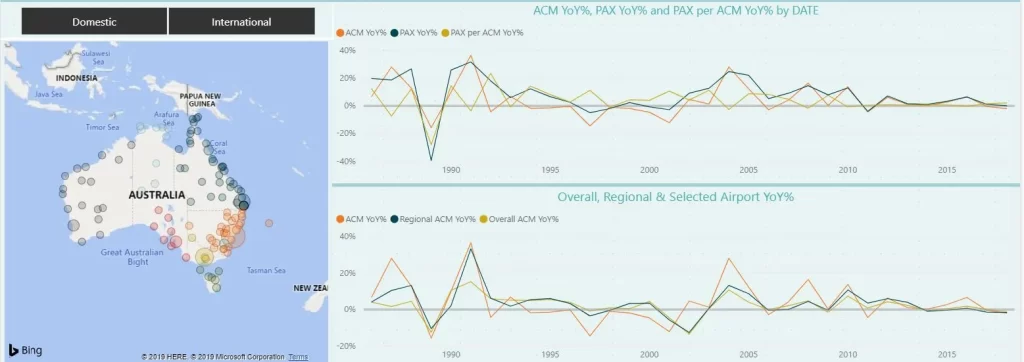

When we analyze the detailed trend of ACM vs PAX vs PAX per ACM, one should remember that ACM and PAX are positively correlated by a factor of 0.97. PAX per ACM is a derived measure based on ACM and PAX also exhibits similar positive correlations albeit the magnitude is smaller.
One interesting observation is the positive correlation between YEAR and PAX per ACM. It is misleading to assume that ‘Time’ will increase and/or decrease, unlike other variables. It indicates indirectly that operational efficiencies are observed with operators undertaking measures such as route pruning, aircraft utilization, and seat optimization. Actions from operators will keep improving the load factor and will continue to have a positive impact on PAX per ACM.
Growth Rate
The growth rate on a year-on-year basis also throws a few interesting observations, where diverging relationships between the variables can be observed.
- Observation #1 When ACM drops and PAX increases, the PAX per ACM also increases.
- Correlation As ACM and PAX are positively correlated, any upward or downward movement will also affect the derived measure in a similar manner, but the quantum is not directly proportional (e.g., ACM -10%, PAX +10% does not equate to PAX per ACM +5%)
- Other Factors With all variables being constant, the Passenger traffic, including the uptick was handled by reduced aircraft through seat utilization.
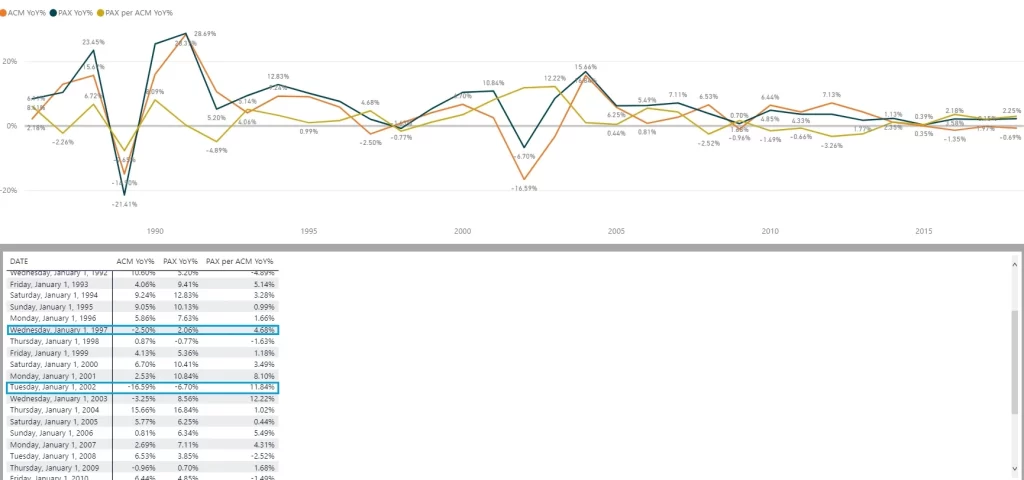
Analyzing the growth trends shows interesting Although the previous statement is simplistic, one has to keep in mind that we are looking at the growth rates and not the absolute value. This inverse relationship between the data points
- Observation #2 When ACM drops and PAX decreases, the PAX per ACM increases.
- Inference As ACM and PAX are positively correlated, any upward or downward movement will also affect the derived measure in a similar manner, but the quantum is not directly proportional (e.g., ACM -10%, PAX -10% does not equate to PAX per ACM +10%)