Data analysis at many instances involves equally segregating a metric based on the metric value. A very common example in BI space is the question “Which customers are in Top 10%?” or vice versa “Which customers fall under Bottom 20%”. In order to answer the question, one has to first pick the sales volume or revenue, whichever is the appropriate metric. Now, the metric is split it into equal parts and ranked based on scenario before arriving at the list of customers i.e. dimensions.
There are several quantiles, and the most frequently used ones in BI context are below and full list can be accessed in wiki here
- 2 – Quantile i.e. median
- 4 – Quartile
- 10 – Decile
- 100 – Centile or Percentile
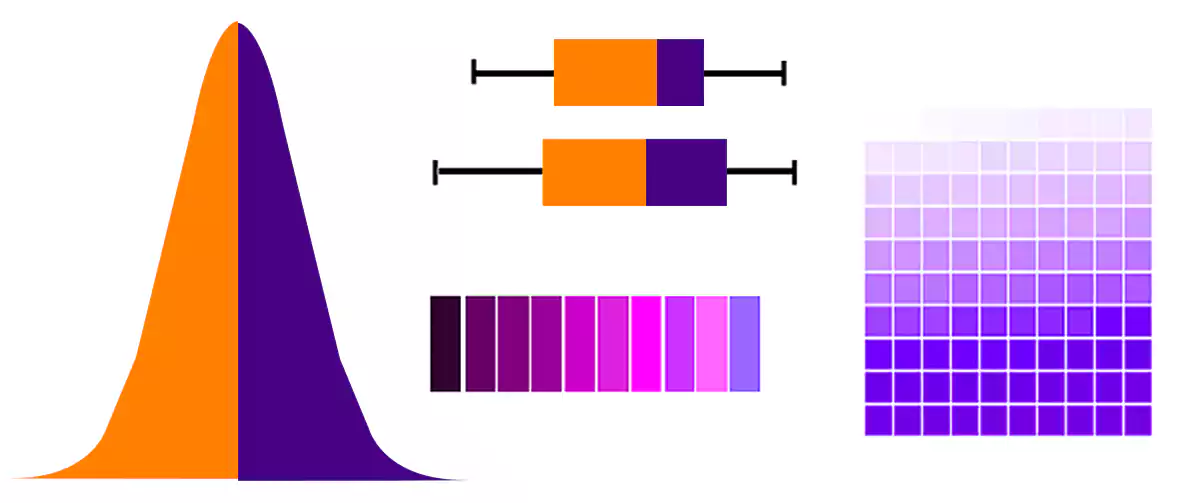
First & foremost and a popular measure that divides a data set into two equal parts is median. This measure splits the data into top 50% and bottom 50% irrespective of distribution type i.e. normal versus skewed.
Another most frequently encountered split is the Inter Quartile Range, IQR for short. This measure builds on median and splits the data into four equal parts where each portion represents 25% of the dataset. Box plots represent the quartile in clear and concise manner along with minimum and maximum boundaries.
Deciles splits the data set into ten equal parts and are typically used in ranking the data as given in example above. A good application of Decile is to validate Power Law or Pareto Principle of two variables.
Centiles or the other hand represents percentile, which as the progression goes splits the data set into 100 equal parts. This term is encountered right from High school days as grades are reported in percentile terms instead of absolute value. Application of centile based analysis is slightly rare to encounter and used in specialized scenarios.
NOTE: NTILE is a special form of window function that can be used directly in a SQL query to calculate different quantiles.
These window functions first partition the result set of a query based on the dimension and then ranks based NTILE parameter i.e. Quartile or Decile etc. The SQL statement can have one or multiple groupings in dimension list, which highly increases the efficiency of this analytic function.