One of the first activities in a Data Warehouse project is the design and implementation of Time Dimension and many factors are come into play during constriction of Time Dimension due to it’s unique nature. Consider few properties of time such as
- Linear and forward looking nature
- Variety in interpretation (Fiscal, Calendar, 445 etc)
- Localized definitions in different regions (GMT vs Local) and adjustments (Daylight Savings)
Time based analytics is an universal need in any BI project and always modeled as a conformed dimension. Due to this nature, time series analysis itself is a specialized area within analytics. In general, time bases analysis is either a series/trend based interpretation or aggregated across periods or point in time i.e. snapshot. Unrolling time data is a mechanism to generate snapshot based on historical data.

Consider Uber as an example wherein the number of rides taken at various time periods across a single day. It is easy to see the total number of rides happening in real time because every second, people constantly book and close rides. If a question arises, “How many rides people tool at 1-Aug-2018 @ 10:30 hrs?”, it cannot be directly interpreted based on current live information. Historical data about rides undertaken can span a period overlapping the period under scrutiny, which makes it essential to unroll data for analysis.
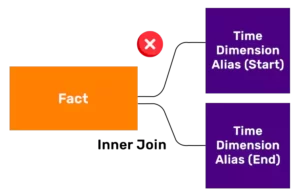
Unrolling time data comes to play when source provides duration in form of two time stamps i.e. Start and End times for a single fact record. In order to derive the snapshot in history, one has to generate multiple snapshots for each timestamp, which can be achieved by using temporal join. In a Temporal join, the BETWEEN clause helps to unroll the data at a minute level granularity. After unrolling data, standard aggregate functions such as COUNT, MAX etc can be applied for calculations.

 Unrolling is a time consuming exercise, both from ETL and Reporting perspective and can result in very long query execution times as temporal joins are the least efficient operators. Unrolling operation creates additional data at run-time thereby increasing volume.In the example above, if data is unrolled at minute level, Ride #1 would generate 29 records.
As a best practice, it is advisable to keep restricted volume of data, e.g. 6 months for ad-hoc analysis and create separate aggregate table for storing snapshots of various KPI’s in aggregated manner.
