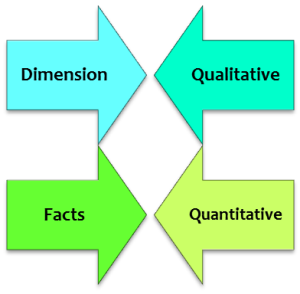
In the world of analytics, the syntax and vocabulary used by data science professionals are slightly different from concepts adopted in the Business Intelligence world. One fundamental understanding that anyone stepping into areas such as data mining, predictive analysis, etc. has to be aware of is the nomenclature used to reference data.
When we work with structured data i.e., Relational Database, are aware of the structure adopted i.e., Rows and Columns, also referred to as Records and Fields. In statistics parlance, a data set used for the analysis also adhere to a tabular format. In this context, a row corresponds to observation, and a column is referred to as a variable. A variable is again classified into two categories i.e., Qualitative & Quantitative variables.
Qualitative:
A variable that is typically represented numerically and is measurable in nature related to an attribute. These correspond to Fact data in a data mart.
Quantitative:
Variables that are descriptive in nature and at times can be represented as numbers (e.g., 1 = Good, 2 = Average, 3 = Bad, etc.). Dimensional data falls into this category in a data mart.

In an Enterprise Data Warehouse environment, we can directly pull the data for analytics directly. A single query on different measures and attributes will give the desired data set. Types of Fact Data play an important role in deciding whether fact data can be used directly as Quantitative data. Facts that are semi-additive and non-additive in nature cannot be used for analytics because they show values at a specific point in time.
Although Enterprise Data Warehouses are a good source of data for analytics, one has to exercise slight caution when selecting measures for analysis. It all goes with the saying GIGO (Garbage In Garbage Out) and the output of an analytics exercise should not result in GIGO.
