“Bias” as the term suggests, is a preconceived notion ‘for’ or ‘against’ anything. Humans have a tendency to be biased on reactions based on their past exposure and experience in life, which at times is built into habit. Human bias in data interpretation is a different topic altogether, but from “data” perspective what would constitute bias? Fundamentally, data is not opinionated, but on the contrary it is binary in nature. Data is always recorded as-is and instances of fake data arise when data is generated with an intent to project an illusion of reality. Remember Enron?
Bias is a important factor to be considered during analysis and this post looks at the term from a different perspective. One perspective of “bias” is the extent of impact in KPI’s by rouge data points or outliers, thus misrepresenting the calculation logic or scenario at hand. If analysis does not consider the fact that certain data points can paint a different picture altogether, then end result of such analysis does not show the 100% truth.
Consider a scenario where sales employees are measured based on time taken to finalize a deal. Performance of all the pipeline orders that were closed is shown in the graph to the right. It is evident that on an average the time taken from initiating the contact to finalizing the order took about 15 days. There is one roGraph_databiasuge data point that stands out i.e. outlier. Assume that one customer had actually walked in, paid cash for the product and walked away, and it was handled by one of the sales employees. This event was captured in the system as a deal that was closed in zero days.
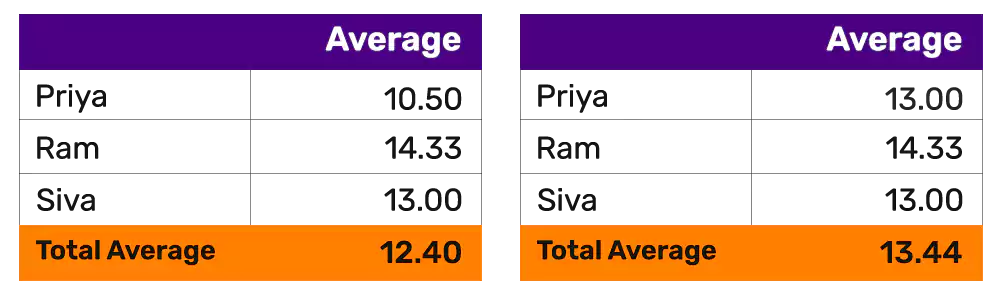
 If we are going to measure the employees performance based on this data it will paint different picture with and without the rouge data point. On the left table one employee is shown as a star performer, but when biasdata is removed the ranking changes drastically on the right table. One question that comes to mind is “Does that mean all outliers have to be excluded during analysis”? The answer is “it depends”. Ignoring data points, unless there is pressing evidence that the selected data points are incorrect is definitely not the norm.
Data can be skewed and it is acceptable to have outliers with data leaning left, right and center. Whenever we are presented with skewed data and outliers, it is better to take cautious approach while deriving KPI’s and it always pays off to dig in deeper and ask multitude of questions before accepting the logic.