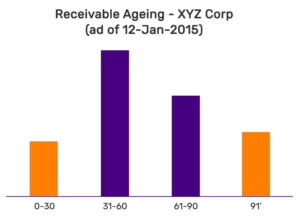
Anyone who has worked in a BI project in Finance and Accounting subject area would have encountered “Ageing Analysis” as a mandatory requirement. This is an example of classical analytic method, where a simple chart shows cash flow and serves as barometer of overall health of a company. Here is a secret; even banks use ageing statements to assess credit worthiness of a company in order to issue loans.
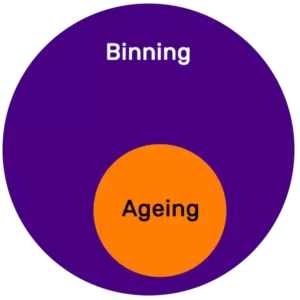
Today, every organization performs an ageing analysis either once or multiple times a day. The main question for this, in what way ageing and binning differ in approach towards data analysis. BinningAgeing1If looked closely, ageing is nothing but a different name given to a similar type of analysis, which generally is referred to a binning. Since the previous statement is ambiguous, clarity on the concept of binning will help in understanding the fine details.
 Let us take a data set of all students in a college and we have to plot the height of each student in form of a graph. Since height of a student can roughly vary anywhere between 4ft to 7ft, the graph with have all values possible within the given range. The values will be 4ft 0.25in, 4ft 0.3in, 4ft, 3.1in etc, up to the maximum possible value. Instead of looking at each value, what if the data is grouped as follows, 0 to 4 ft, 4 – 5ft, 5 to 6ft, 6 to 7ft and above 7ft. Now, the graph will show only 5 groupings, or in other words 5 distinct bins of data. This is a very high level introduction to the concept of binning and there are many more factors that come into play while analyzing live data.

Coming back to our main topic of the difference betweBinningAgeingen these two concepts, Binning is a general approach to any measurable value which can be applied in all areas of analytics whereas Ageing is specific to the subject area of “Finance and Accounting”.
Data in an ageing chart predominantly refers to a monetary amount and sometimes the count of invoices. Another important factor is the base reference date or 0th (zero-th) date based on which the entire chart is derived and plotted, changes every day. In several engagements, this base date was user specific and majority of cases were dynamically entered by the end user. This allowed the user to look at snapshot for different dates and compare them for analysis needs.
